Top 10 Power BI Sample Reports to Simplify Your Business Analytics
Posted on March 03, 2025

Contents
It is crucial to recognize that businesses often underestimate the importance of selecting the appropriate Power BI sample reports to streamline their analytics processes. Every business thrives on data, but navigating through endless reports can feel overwhelming. The key to making sense of all that information lies in choosing the right Power BI dashboards. When businesses rush into creating reports without a clear strategy, the result is often cluttered data, slow decision-making, and frustrated teams.
Too many reports lack focus, making it tough to extract meaningful insights. When user roles aren’t considered, dashboards become too generic, leaving team members puzzled about what the data’s actual meaning. A scattered approach to integrating data sources can also create gaps, making it impossible to get a complete picture of business performance. Additionally, slow dashboards, limited mobile access, and poor security controls further add to the challenge.
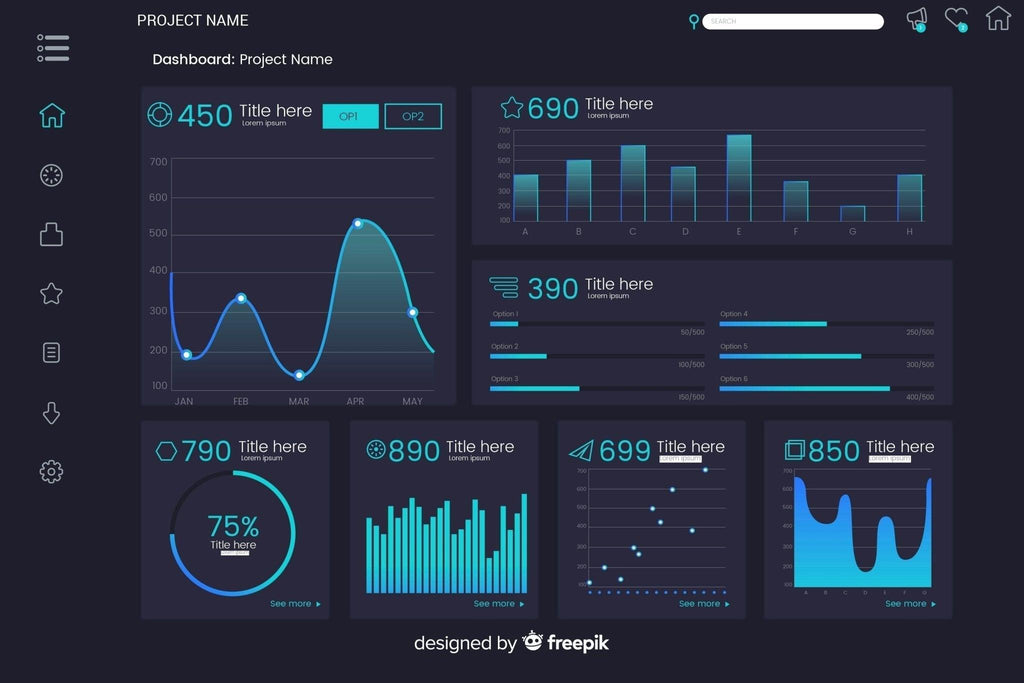
But with the right Power BI sample reports, businesses can cut through the noise, simplify analytics, and make smarter decisions. Here are some of the most effective Power BI dashboards that bring clarity and efficiency to business analytics.
1. Sales Performance Dashboard
Keeping track of sales numbers can feel like chasing shadows without a structured report. This dashboard simplifies the process by offering a clear view of revenue, profit margins, and sales trends.
Key Features:
- Tracks sales performance over time
- Identifies top-selling products and regions
- Compares actual sales with targets
Best for: Sales managers and business leaders who want to spot growth opportunities and fine-tune strategies.
2. Financial Overview Report
Numbers tell a story, but only if they’re presented the right way. This report helps businesses stay financially healthy by breaking down revenue, expenses, and cash flow.

Key Features:
- Profit and loss summaries
- Insights into revenue vs. expenses
- Trend analysis for financial planning
Best for: CFOs and finance teams looking to maintain stability and optimize budgeting.
3. Marketing Analytics Dashboard
Understanding what works in marketing can be tricky without the right metrics. This dashboard uncovers the true impact of marketing efforts, helping teams refine strategies and maximize returns.
Key Features:
- Tracks website traffic and social media engagement
- Measures campaign ROI
- Analyzes customer acquisition costs
Best for: Marketing managers and digital strategists aiming for better campaign performance.
4. Customer Satisfaction Report
Customer feedback is gold, but it often gets lost in spreadsheets. This report organizes customer sentiments, making it easy to track satisfaction levels and improve service quality.
Key Features:
- Analyzes Net Promoter Scores (NPS)
- Reviews customer sentiment trends
- Tracks support response times
Best for: Customer service teams and product managers committed to enhancing customer experience.
5. HR Employee Performance Dashboard
A motivated workforce is the backbone of any business. This report keeps a pulse on employee engagement, turnover rates, and training effectiveness.
Key Features:
- Monitors employee retention trends
- Evaluates engagement levels
- Tracks training program success
Best for: HR managers focused on boosting productivity and reducing attrition.
6. RetailmInventory Management Report
Stocking too much or too little can hurt business. This dashboard helps retail teams strike the perfect balance by keeping an eye on inventory trends.
Key Features:
- Tracks inventory turnover
- Sends alerts for stock shortages
- Evaluates supplier performance
Best for: Retailers and supply chain managers who want smooth inventory management.
7. Executive KPI Dashboard
Leaders need a high-level view of business performance without getting lost in details. This report provides clear insights on key performance indicators (KPIs).
Key Features:
- Tracks business growth trends
- Monitors department-specific KPIs
- Uses predictive analytics for forecasting
Best for: Executives looking for data-driven decision-making at a glance.
8. Healthcare Analytics Report
Hospitals and clinics handle vast amounts of data daily. This dashboard ensures that patient care remains efficient and operations run smoothly.
Key Features:
- Analyzes patient wait times
- Tracks bed occupancy rates
- Measures treatment success rates
Best for: Healthcare administrators focused on improving patient care.
9. E-commerce Performance Dashboard
Online businesses rely on customer insights to boost sales. This report uncovers key trends in purchasing behavior and shopping habits.
Key Features:
- Tracks conversion rates and cart abandonment
- Evaluates product performance
- Analyzes customer lifetime value
Best for: E-commerce owners and digital marketers keen on increasing sales and retention.
10. IT Operations & Incident Management Report
Downtime and tech issues can disrupt operations. This dashboard helps IT teams monitor system performance and respond quickly to incidents.
Key Features:
- Tracks response times for IT incidents
- Analyzes system downtime patterns
- Ensures compliance with SLAs
Best for: IT managers dedicated to maintaining seamless business operations.
DataFlip: Transforming Business Analytics
Managing data shouldn’t feel like an uphill battle. DataFlip simplifies analytics, providing businesses with real-time reporting and actionable insights. By integrating powerful Power BI solutions, it helps organizations cut through complexity, enhance decision-making, and stay ahead in today’s competitive landscape.
With the right tools in place, businesses can turn data into a growth engine, maximizing efficiency, improving strategies, and making well-informed decisions with confidence.


