



Ready-to-Use Power BI Dashboards and Templates That Solve Real Business Problems
DataFlip’s Power BI dashboards solve key business challenges in Sales, Finance, Supply Chain, and HR empowering teams to focus on driving results instead of reporting.
Top Reasons to Choose Dataflip for Power BI Dashboards & Templates
DataFlip offers expertly designed Power BI dashboards and templates that help you visualize business performance instantly. Our ready-to-use solutions save time, enhance reporting accuracy, and drive smarter decisions.
Solve Real Business Problems
Go beyond pretty visuals. DataFlip dashboards tackle issues like manual reporting, scattered data, and delayed decision-making.
Save Time & Cost
Deploy dashboards in hours, not weeks. No need to reinvent the wheel when smarter dashboards already exist.
Fully Customizable
Easily edit visuals, formulas, and layouts to align with business KPIs, ensuring every dashboard reflects organizational needs.
One-Time Purchase, Lifetime Access
Pay once and use dashboards forever with free updates included, delivering lasting value without recurring costs.
Immediate Access
Download the dashboard instantly and start analyzing data immediately after purchase, unlocking insights without any delay.
Dedicated Support & Updates
Get fast, responsive support from the dedicated team, ensuring any questions or issues with the dashboards are resolved quickly.
How Dataflip’s Power BI Dashboards & Templates Help Solve Business Challenges Faster
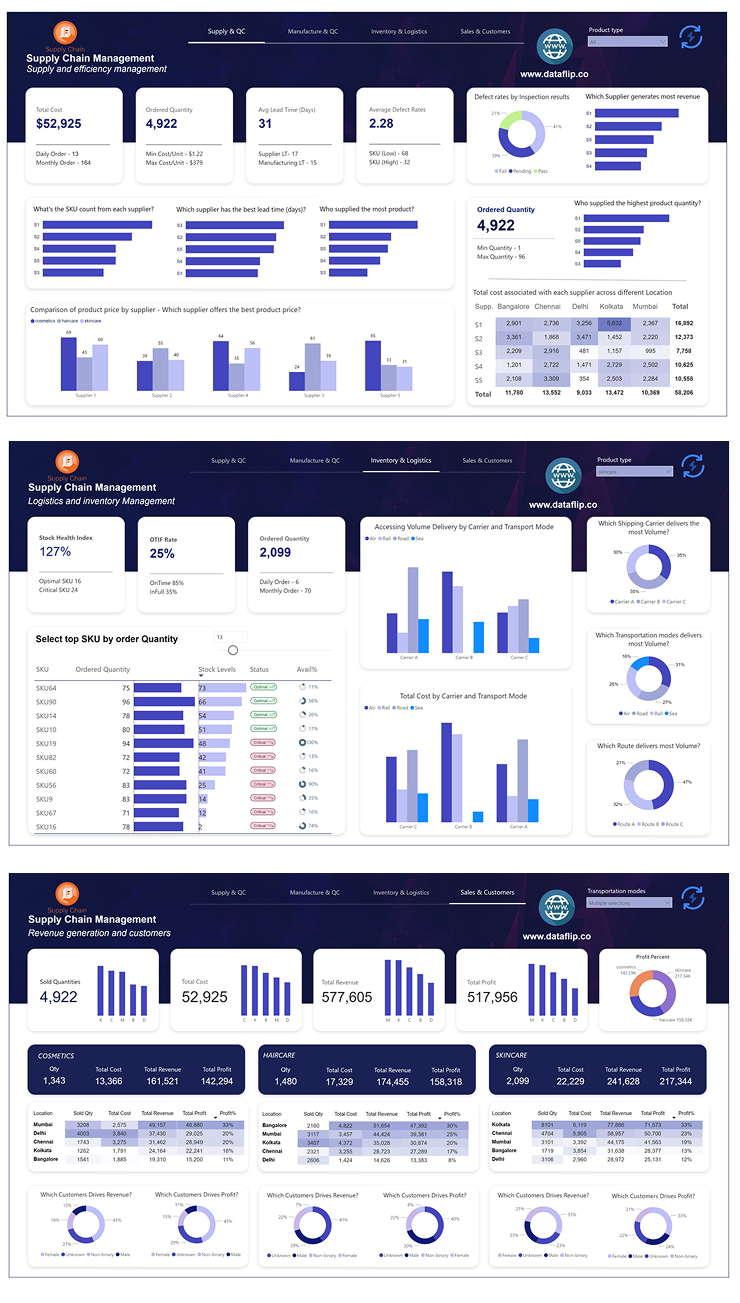
Optimize Supply Chain Management Efficiency
The Challenge:
Stockouts, excess inventory, and supplier delays create costly inefficiencies. This makes it difficult to balance efficiency with service levels and control overall costs.
How DataFlip Power BI Templates Help:
Gain a 360° view of inventory, suppliers, and logistics with our Supply Chain
Power BI Dashboards. Predict shortages, reduce carrying costs, and streamline
operations with accurate, data-driven insights.

HR Analytics That Drive Employee Retention
The Challenge:
High turnover reports don’t explain why employees leave. This makes it difficult to identify the real causes of attrition and take effective retention actions.
How DataFlip Power BI Templates Help:
Break down patterns by role, salary, and tenure with HR Power BI Dashboards.
Discover the root causes of attrition and take data-driven steps to improve
employee retention.

GAIN COMPLETE FINANCIAL CLARITY WITH CFO DASHBOARD
The Challenge:
Without a unified view, finance teams struggle with scattered reports, delayed insights,
and unclear visibility into profitability, cash flow, and overall financial health.
How DataFlip Power BI Templates Help:
Track revenue, costs, profitability, and cash flow in one unified dashboard. Identify
financial trends, control expenses, and make faster, data-driven decisions with complete confidence.
Solve Every Business Challenge with the Right Dashboard Using Dataflip’s Power BI Templates


