



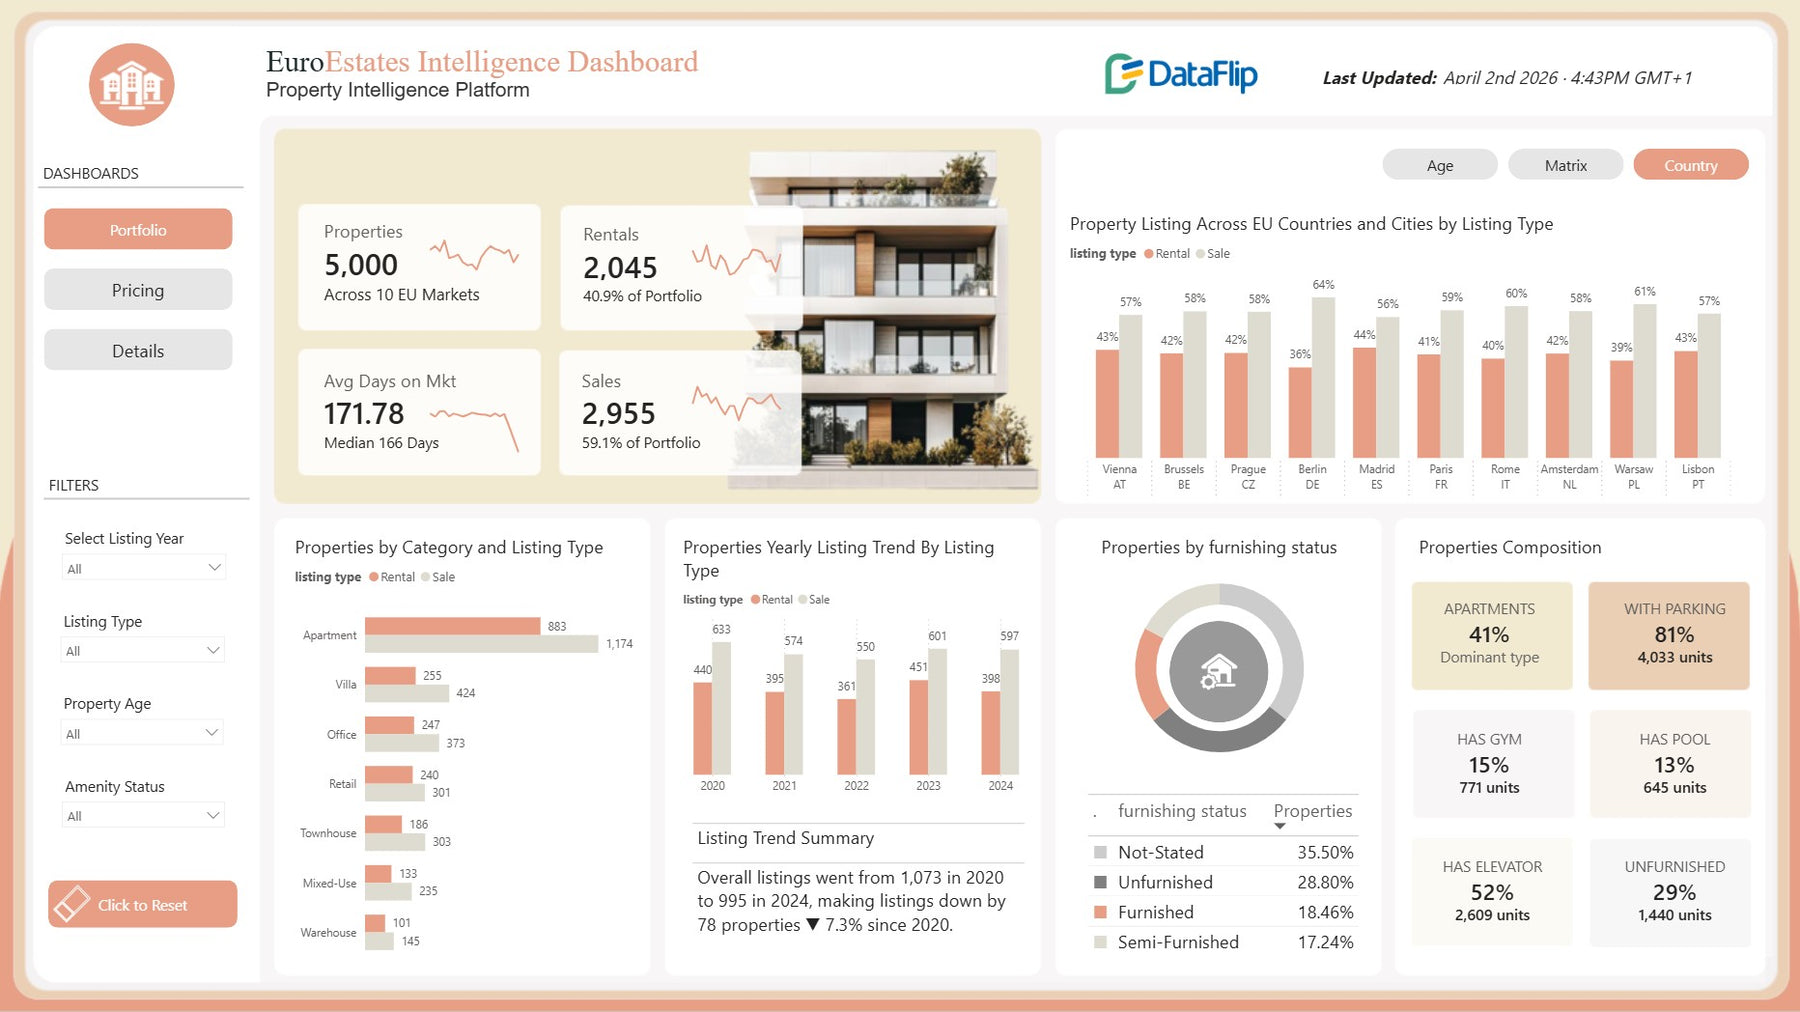


Real Estate Property Analysis Power BI Dashboard Template for Sales & Rental Insights
simple to use, smarter decision-making
- Fully customizable templates
- No monthly fees – one-time purchase
- Instant download after purchase
- Dedicated help and support included
- Lifetime access and future updates
Guaranteed Safe Checkout

Still guessing property prices? Still relying on scattered reports to make high-stakes decisions?
The Real Estate Property Analysis Power BI Dashboard Template gives you instant clarity. This ready-to-use real estate dashboard Power BI solution combines property sales analytics, rental analytics, and pricing insights into one powerful view, so you can spot opportunities, fix pricing mistakes, and act faster than the market.
✔ Identify overpriced listings before they impact conversion rates
✔ Discover high-demand locations and property types
✔ Understand what actually drives property value
✔ Make confident investment and pricing decisions in minutes
If you want faster deals, better margins, and smarter decisions, this is the dashboard that gives you the edge.
This dashboard transforms property intelligence into a strategic advantage by reducing 18–28% sales cycle delays enabling more profitable real estate decisions.
This Real Estate Property Analysis Power BI Dashboard Template delivers a powerful real estate dashboard Power BI experience that unifies property sales analytics, rental analytics, and pricing insights into one intelligent system, helping you price smarter, sell faster, and maximize returns with confidence.
Benefits of Property Pricing Analysis Power BI
- Monitor properties across markets in a unified real estate portfolio analysis view
- Track rentals and sales to understand market distribution
- Analyze average days on market to identify slow-moving listings
- Compare average vs median rent and sale price
- Detect pricing skew and overvaluation gaps affecting deal closures
- Evaluate amenity impact on price per SQM (parking, gym, pool, elevator)
- Analyze property types (apartment, villa, office, retail, townhouse, mixed-use)
- Track furnishing status distribution and property composition trends
- Compare price per SQM across countries for investment decisions
- Leverage dynamic insights and recommendations
Who Can Use This Template
- Real estate investors and portfolio managers
- Property consultants and brokers
- Real estate analytics teams
- Developers and asset management firms
- Rental business owners and agencies
How to Use This Template
- Load your property dataset into Power BI file
- Map key fields like pricing, listings, amenities, and property types
- Apply filters (country, listing type, furnishing, amenities, energy rating)
- Analyze pricing trends, demand patterns, and property performance
- Use dynamic insights and recommendations for decision-making
Turn property data into faster sales and smarter investments today.
Detailed Description of Real Estate Dashboard Power BI & Property Analytics
- Track total properties with full real estate KPI dashboard visibility
- Monitor rental vs sales split to understand demand balance
- Analyze average days on market to optimize listing strategies
- Evaluate property sales analytics dashboard metrics including total sales and pricing trends
- Compare average vs median rent and sale values to detect pricing inefficiencies
- Identify overpricing risks and pricing gaps impacting conversions
- Perform rental analytics Power BI template insights with rent distribution and pricing trends
- Analyze bedroom-level pricing patterns (1 Bed to 5+ Bed) for better segmentation
- Measure amenity impact to understand what truly drives property value
- Identify high-value features influencing premium pricing
- Analyze property category performance and listing trends
- Track portfolio composition, furnishing status, and energy ratings
- Compare price per SQM across countries to identify high-return markets
- Use interactive filters and drilldowns for deeper real estate market insights dashboard analysis
Business Impact of Property Investment Analytics
- Improve pricing accuracy and reduce overvaluation
- Shorten time on market and increase conversion rates
- Identify high-demand properties and profitable segments
- Optimize portfolio allocation and investment strategy
- Enable faster, data-driven property investment decisions
What’s Included
- Fully interactive Power BI Dashboard (.pbix file)
- Sample real estate dataset in Excel
- User Guide PDF with instructions to connect and change data sources from the sample dataset
- PowerPoint Background Design to apply background colors and themes for brand identity
- Built-in dynamic insights and recommendations
Technical Details
- File Format: .pbix (Power BI Desktop)
- Tool Required: Microsoft Power BI Desktop
- Data Compatibility: Excel, CSV, and Google sheet database sources
- Fully customizable visuals, KPIs, and filters
- Visualize insights using a mix of native and HTML-based custom visuals for enhanced storytelling
Download now and transform your real estate data into high-confidence decisions.
FAQ
Q1. Can this dashboard help in pricing properties accurately?
Yes, it compares average vs median values and highlights pricing gaps to support better pricing decisions.
Q2. Does it cover both rental and sales analysis?
Yes, it provides complete visibility into rental and sales performance in one dashboard.
Q3. Can I identify which features increase property value?
Yes, it analyzes the impact of amenities like parking, gym, pool, and elevator on pricing per SQM.
Q4. Can I customize it with my own data?
Absolutely. You can connect your dataset and modify all KPIs and visuals as needed.
Q5. Are insights automated or static?
Insights and recommendations are dynamic, updating automatically based on selected filters.