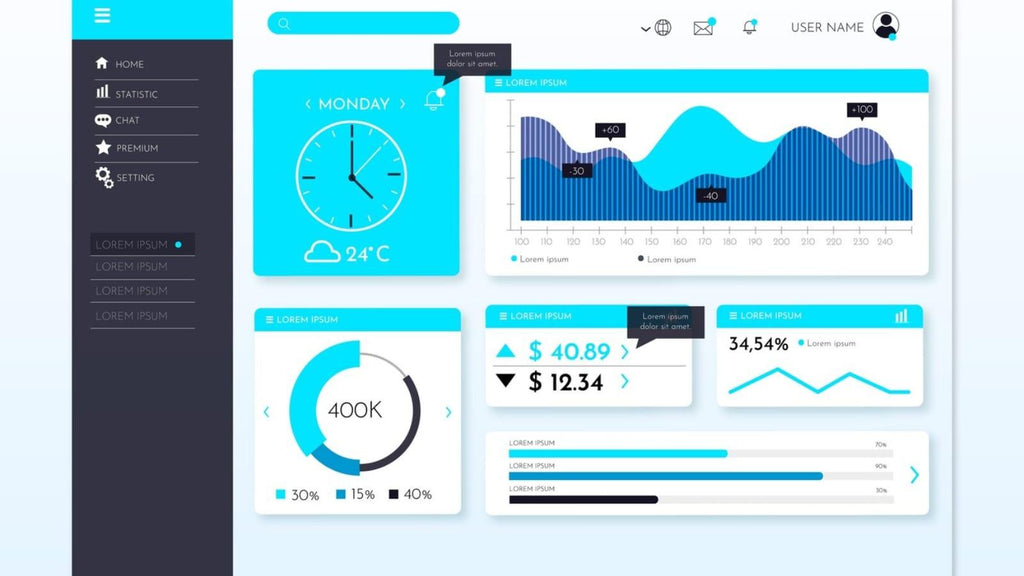
The Best Power BI Sales Dashboard Templates for U.S. Businesses in 2025
Posted on February 16, 2025

Contents
Businesses can revolutionize their sales strategy with a Power BI sales dashboard, turning raw data into actionable insights. Envision a business trying to navigate a competitive market without a clear understanding of its sales performance. It feels like driving in the dark without headlights. The numbers are there, but without structure and visualization, they remain just that, numbers.
Many businesses struggle to organize sales data effectively, leading to missed opportunities, delayed decisions, and inefficiencies. Without real-time visibility, key insights slip through the cracks, making it difficult to forecast sales trends or track marketing performance. Analyzing profitability across multiple channels becomes a challenge, leaving businesses guessing rather than strategizing. The increasing demands of compliance and regulatory reporting only add to the complexity, making it clear that traditional reporting tools are no longer enough.
Power BI sales dashboards step in as the solution, transforming raw data into meaningful insights. With a well-structured dashboard, businesses gain clarity, speed, and accuracy in decision-making, staying ahead in an ever-evolving market.
Transforming Sales Insights with Power BI Dashboards
A well-designed Power BI sales dashboard does more than just present numbers, it tells a story. Businesses leveraging these dashboards can:
- Gain real-time insights into sales performance, customer behaviors, and profit margins.
- Automate reporting, eliminating the need for tedious manual data entry.
- Strengthen sales forecasts with accurate, data-backed predictions.
- Evaluate marketing campaigns and sales team performance with measurable results.
- Consolidate data from multiple sources for a comprehensive business overview.
- Use engaging visualizations to accelerate strategic decision-making.
Shifting from reactive to proactive decision-making makes all the difference in a competitive landscape. Businesses that embrace data-driven insights gain an undeniable edge.
Top Power BI Sales Dashboard Templates
To make the most of sales data, businesses need the right dashboard. Pre-built Power BI templates take the guesswork out of analytics, offering immediate insights tailored to different business needs.
Sales Performance Dashboard
Tracking sales over time is essential for sustained growth. This dashboard provides a clear view of sales trends, helping businesses compare current numbers to past performance. By analyzing profit margins, monthly revenue breakdowns, and distribution insights, companies can identify strengths and areas for improvement.
Profit Analysis Dashboard
A successful business thrives on profitability. This dashboard offers a detailed look at profit trends, identifying peak and low-performing periods. By assessing profit distribution across suppliers, locations, and product lines, businesses can make informed pricing and inventory decisions.
Sales Trends Dashboard
Understanding market trends and sales fluctuations across different regions is key to strategic planning. This dashboard highlights month-over-month sales growth, showcases channel-specific performance, and provides regional insights, allowing businesses to fine-tune strategies for maximum impact.
Customer Acquisition Dashboard
This dashboard tracks how new customers are acquired across various channels. It analyzes referral sources, social media impact, email campaigns, and organic search performance. Businesses can gain insights into which strategies are bringing in the most valuable customers.
Lead Conversion Dashboard
Rather than just monitoring paid or organic traffic, this dashboard focuses on how well leads turn into paying customers. It includes key metrics like lead response time, conversion rates by source, and customer retention insights, helping businesses optimize sales pipelines.
Transforming E-Commerce with Power BI: DataFlip's Revolutionary Impact
For online retailers, precise tracking of sales performance is non-negotiable. DataFlip offers a tailored Power BI template for e-commerce businesses, covering essential metrics such as:
- Comprehensive breakdowns of total sales, profits, and order volumes.
- Year-over-year sales comparisons and market segmentation insights.
- Performance tracking of top-selling products and profit margins.
- Analysis of regional sales and the impact of discounts.
- Evolving customer purchasing trends and behavioral insights.
With this template, e-commerce businesses gain the ability to optimize pricing, enhance operations, and boost customer engagement, ultimately driving revenue growth.
Making the Most of Power BI Dashboards
Numbers alone don’t drive success, understanding them does. The right Power BI dashboard turns scattered data into a strategic advantage. Whether the goal is to refine marketing efforts, improve financial planning, or enhance operational efficiency, these dashboards provide the insights needed to thrive.
The landscape of data analytics continues to evolve, and businesses that embrace intelligent dashboards position themselves for sustained success. By leveraging the power of Power BI, organizations can uncover hidden trends, stay ahead of challenges, and seize new opportunities in 2025 and beyond.
DataFlip: The Partner for Smarter Business Decisions
Managing sales data shouldn’t feel overwhelming. DataFlip delivers cutting-edge Power BI solutions, making analytics accessible and actionable. With real-time reporting, seamless integrations, and a focus on delivering valuable insights, DataFlip helps businesses optimize operations, refine marketing strategies, and keep a pulse on financial health.
The future of business success lies in data-driven decision-making. With the right tools and expertise, businesses can navigate challenges, seize growth opportunities, and stay ahead in an increasingly competitive market.


