



Marketing Analytics Dashboard Power BI: Track Campaigns, Leads & ROAS in 2026
Posted on July 29, 2026

Contents
Marketing teams have never had access to more data than they do today. Every campaign, click, impression, lead, and conversion generates valuable insights across multiple platforms. Google Ads, Meta Ads, LinkedIn Ads, Google Analytics 4, CRM systems, email marketing platforms, and social media tools all contribute pieces of the marketing performance puzzle.
The challenge is that this data often lives in separate systems. Marketing managers frequently switch between dashboards, export spreadsheets, and manually combine reports before they can answer basic business questions such as:
-
Which campaigns generate the highest return on ad spend (ROAS)?
-
Which channels produce the most qualified leads?
-
How much revenue came from paid search versus organic traffic?
-
Where is the marketing budget being wasted?
-
Which campaigns should receive additional investment?
Manual reporting is not only time consuming but also increases the risk of errors, inconsistent metrics, and delayed decision-making. In fast moving markets, waiting until the end of the month to evaluate campaign performance can mean missed opportunities and unnecessary spending.
This is where a Marketing Analytics Dashboard in Power BI becomes a strategic advantage.
Instead of relying on disconnected reports, Power BI brings marketing data into a single, interactive dashboard that updates automatically. Teams gain a real-time view of campaign performance, customer acquisition, attribution, lead generation, and revenue, enabling faster, more informed decisions.
Whether you are a marketing manager tracking daily performance, a CMO reviewing quarterly ROI, or a digital agency managing multiple clients, Power BI provides the visibility needed to optimize campaigns and demonstrate measurable business impact.
In this blog, you will learn how to build an effective marketing analytics dashboard Power BI solution, explore the most important KPIs for 2026, understand attribution models, connect marketing platforms, and discover best practices for creating automated reporting that scales with your business
What Is a Marketing Analytics Dashboard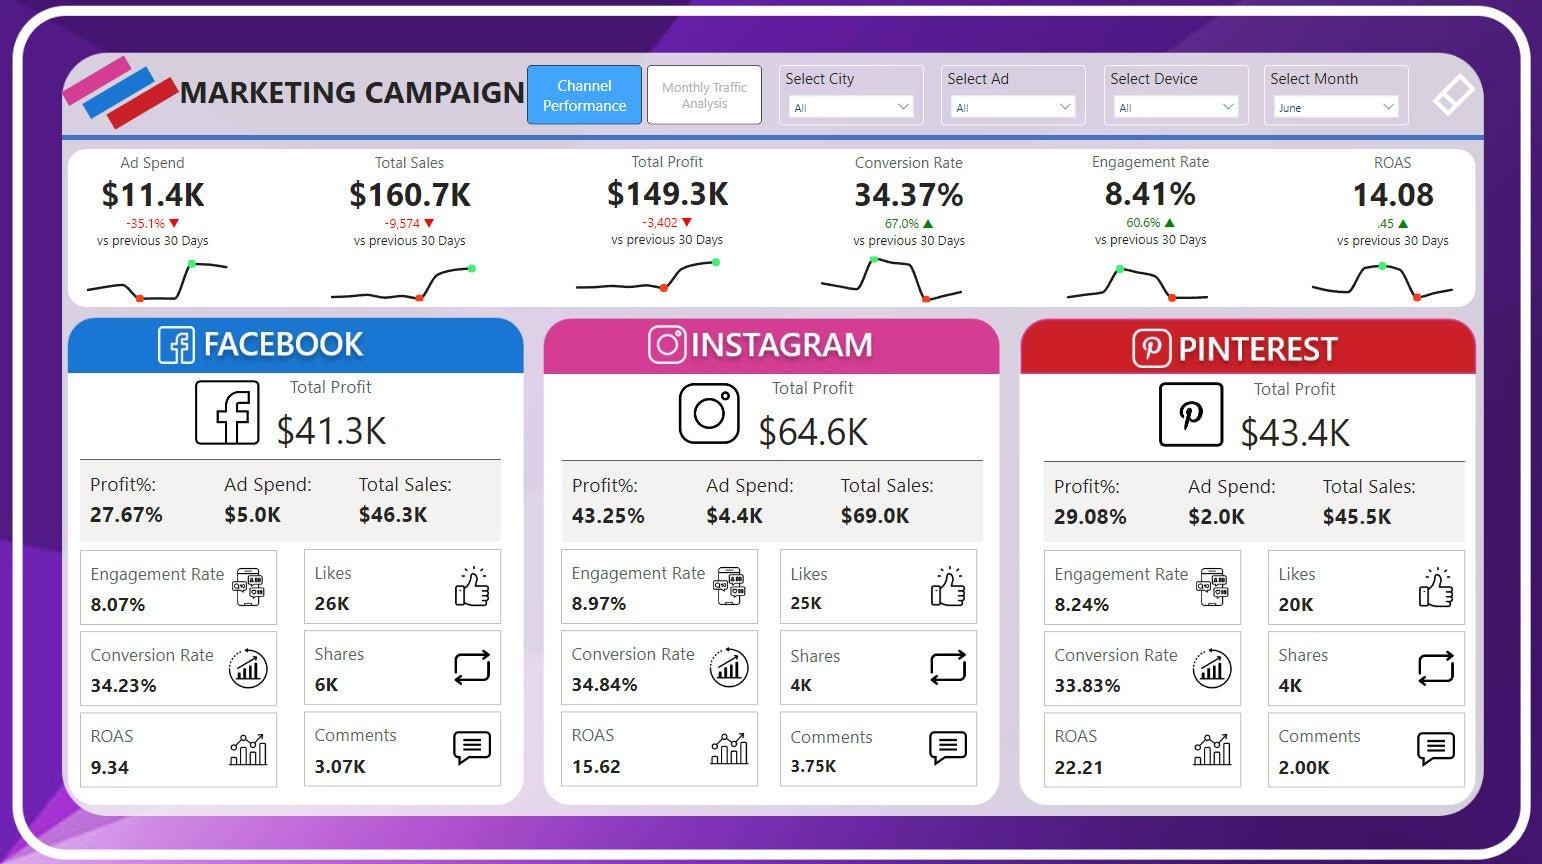
A marketing analytics dashboard is a centralized reporting solution that consolidates data from multiple marketing platforms into one interactive view. Instead of analyzing separate reports from advertising platforms, CRM systems, website analytics, and email tools, decision-makers can monitor all critical metrics from a single source of truth.
A modern dashboard goes beyond displaying numbers. It transforms raw marketing data into meaningful insights that support strategic planning, budget allocation, and campaign optimization.
Core Functions of a Marketing Analytics Dashboard
A comprehensive dashboard enables organizations to:
-
Monitor campaign performance in real time
-
Track marketing KPIs across channels
-
Compare advertising platforms
-
Measure lead generation performance
-
Evaluate customer acquisition costs
-
Analyze conversion funnels
-
Understand marketing attribution
-
Connect marketing spend with revenue
-
Identify trends and anomalies quickly
By bringing together data from paid, owned, and earned channels, organizations gain complete visibility into their marketing performance.
Why Centralized Reporting Matters
Many organizations still rely on manual exports from multiple platforms.
A typical reporting workflow often looks like this:
|
Traditional Reporting |
Centralized Power BI Dashboard |
|---|---|
|
Export Google Ads reports |
Automatic data refresh |
|
Download Meta Ads data |
Live campaign metrics |
|
Export GA4 reports |
Unified customer journey |
|
Combine Excel files |
Single source of truth |
|
Create PowerPoint reports |
Interactive dashboards |
|
Repeat every week |
Continuous reporting |
The traditional approach can consume several hours each week. A centralized Power BI dashboard automates these repetitive tasks, allowing marketing teams to focus on strategy rather than report preparation.
Benefits of Cross-Platform Visibility
Marketing performance rarely depends on a single channel.
Consider a typical customer journey:
-
A prospect discovers your brand through Google Search.
-
They visit your website and leave without converting.
-
A Meta Ads retargeting campaign brings them back.
-
They subscribe to your email newsletter.
-
An email campaign nurtures the lead.
-
A sales representative closes the opportunity through your CRM.
Without integrated reporting, each platform may claim credit for the same conversion. A marketing analytics dashboard provides the context needed to understand the complete customer journey and allocate budget more effectively.
Supporting Better Business Decisions
A dashboard should answer business questions rather than simply display metrics.
For example, an executive team may want to know:
-
Which campaigns generated the highest revenue?
-
Which marketing channels have the lowest cost per acquisition?
-
Are marketing-qualified leads increasing month over month?
-
Is the advertising budget producing positive ROI?
-
Which regions show the strongest campaign performance?
-
How does this month's performance compare with last quarter?
Instead of manually compiling reports, Power BI enables users to filter data by campaign, channel, geography, product, or time period, providing instant answers to these questions.
Real-World Business Scenario
Imagine a software company running campaigns across Google Ads, LinkedIn Ads, email marketing, and organic search.
Without a centralized dashboard, the marketing team spends nearly two days each month preparing reports. By the time leadership reviews the data, underperforming campaigns have already consumed significant budget.
After implementing a Power BI marketing analytics dashboard, the company achieves:
-
Automated daily reporting
-
Unified campaign performance tracking
-
Real-time ROAS monitoring
-
Executive KPI scorecards
-
Improved budget allocation
-
Faster campaign optimization
The result is less time spent reporting and more time improving marketing performance.
Why Use Power BI for Marketing Analytics?
Microsoft Power BI has become one of the leading business intelligence platforms because it combines powerful analytics capabilities with ease of use. For marketing teams, it offers a flexible way to transform fragmented campaign data into interactive reports that support both operational and strategic decision-making.
Unlike static spreadsheets or platform specific reports, Power BI creates a unified analytics environment where marketers can monitor performance across every stage of the customer journey.
1. Automated Data Refresh
Manual reporting quickly becomes unsustainable as marketing channels multiply.
Power BI automates data collection by connecting directly to advertising platforms, CRM systems, databases, spreadsheets, and APIs. Reports can refresh multiple times each day, ensuring stakeholders always have access to the latest performance metrics.
Benefits include:
-
Reduced manual effort
-
Faster reporting cycles
-
Consistent metrics
-
Improved data accuracy
-
More time for campaign optimization
2. Scalable Reporting for Growing Businesses
Whether managing five campaigns or five hundred, Power BI scales with your reporting needs.
Organizations can begin with a single digital marketing KPI dashboard and expand into more advanced analytics as new marketing channels and business units are added.
Common scalability features include:
-
Multi brand reporting
-
Multi country dashboards
-
Client specific agency reporting
-
Department level access
-
Enterprise-wide analytics
3. Seamless Microsoft Ecosystem Integration
Organizations already using Microsoft technologies benefit from native integration with:
-
Excel
-
Microsoft Teams
-
SharePoint
-
Azure SQL
-
Dynamics 365
-
Microsoft Fabric
-
OneDrive
This allows marketing insights to flow naturally into existing business processes without requiring additional reporting tools.
4. Interactive Visualizations
Unlike traditional spreadsheets, Power BI enables users to explore data visually.
Popular visualizations include:
-
KPI cards
-
Trend lines
-
Geographic maps
-
Funnel charts
-
Waterfall charts
-
Heat maps
-
Treemaps
-
Scatter plots
-
Interactive matrices
Users can drill into specific campaigns, compare channels, and filter results without creating multiple reports.
For example, a CMO can start by reviewing total marketing spend and then drill down into individual campaigns contributing to changes in ROAS.
5. AI-Powered Insights
Power BI includes built-in AI capabilities that help marketers uncover patterns they might otherwise overlook.
Examples include:
-
Automatic anomaly detection
-
Forecasting future performance
-
Key influencer analysis
-
Smart narratives
-
Natural language querying
-
Trend identification
These features help teams move beyond descriptive reporting toward predictive and prescriptive analytics.
6. Drill-Through Analysis
High level KPIs often reveal what happened, but marketers also need to understand why.
Power BI's drill-through functionality allows users to move from executive summaries to detailed campaign analysis in just a few clicks.
For example:
Revenue → Campaign → Ad Group → Keyword → Conversion
This layered approach helps identify the exact drivers behind marketing performance.
7. Secure Collaboration and Sharing
Marketing reports are often consumed by multiple stakeholders, including executives, sales leaders, finance teams, and external agencies.
Power BI simplifies collaboration through:
-
Shared workspaces
-
Interactive dashboards
-
Mobile access
-
Scheduled email subscriptions
-
Embedded analytics
-
Microsoft Teams integration
Everyone works from the same trusted data, reducing confusion caused by multiple report versions.
8. Scheduled Refresh and Near Real-Time Monitoring
Campaign performance changes throughout the day.
Power BI supports scheduled refreshes that keep dashboards up to date without manual intervention. Depending on the data source and licensing, reports can refresh multiple times daily or use streaming datasets for near real-time monitoring.
This enables marketing teams to:
-
Detect underperforming campaigns early
-
Monitor daily budget pacing
-
Track lead volume as it happens
-
Respond quickly to sudden performance changes
9. Row-Level Security (RLS)
For organizations managing multiple brands, regions, or clients, data security is essential.
Power BI's Row-Level Security allows administrators to control exactly what each user can view.
Examples include:
-
Regional managers see only their territory.
-
Agency clients access only their own dashboards.
-
Marketing managers view department level data.
-
Executives access company-wide performance.
This ensures secure, role-based reporting while maintaining a single centralized data model.
Why Power BI Stands Out for Marketing Teams
|
Feature |
Business Benefit |
|---|---|
|
Automated data refresh |
Eliminates manual reporting |
|
Cross platform integration |
Creates a single source of truth |
|
Interactive dashboards |
Enables faster analysis |
|
AI-driven insights |
Identifies trends and anomalies |
|
Drill-through capabilities |
Supports root cause analysis |
|
Scheduled refresh |
Keeps reports current |
|
Row Level Security |
Protects sensitive data |
|
Microsoft ecosystem integration |
Fits seamlessly into existing workflows |
|
Scalable architecture |
Grows with business needs |
Best Practice: Build dashboards around business questions rather than data sources. Executives care about revenue, ROAS, and pipeline contribution, not which platform generated the data. A well-designed Power BI dashboard starts with strategic objectives and uses data to provide clear, actionable answers.
Essential Marketing KPIs to Track in 2026
An effective marketing analytics dashboard Power BI solution should focus on KPIs that directly influence business growth. While every organization tracks metrics differently, the following KPIs provide a balanced view of campaign efficiency, lead generation, customer acquisition, and revenue performance.
|
KPI |
Definition |
Why It Matters |
Recommended Visualization |
|---|---|---|---|
|
ROAS (Return on Ad Spend) |
Revenue generated for every dollar spent on advertising |
Measures advertising profitability and budget efficiency |
KPI Card with Trend Line |
|
ROI (Return on Investment) |
Net profit divided by total marketing investment |
Evaluates the overall effectiveness of marketing initiatives |
KPI Card with Gauge |
|
CPC (Cost Per Click) |
Average cost paid for each advertisement click |
Helps optimize bidding strategies and advertising costs |
Line Chart |
|
CPA (Cost Per Acquisition) |
Cost required to acquire a customer |
Indicates acquisition efficiency across channels |
Bar Chart by Campaign |
|
CPL (Cost Per Lead) |
Average cost to generate a qualified lead |
Tracks lead generation performance and campaign quality |
KPI Card + Trend |
|
Conversion Rate |
Percentage of visitors who complete a desired action |
Measures landing page and campaign effectiveness |
Funnel Chart |
|
CTR (Click-Through Rate) |
Percentage of impressions resulting in clicks |
Indicates ad relevance and creative performance |
Line Chart |
|
CAC (Customer Acquisition Cost) |
Total marketing and sales cost per new customer |
Essential for profitability analysis |
KPI Card |
|
Customer Lifetime Value (LTV) |
Total revenue expected from a customer over their relationship |
Helps determine sustainable acquisition spend |
Card with Comparison |
|
Marketing Revenue |
Revenue directly influenced by marketing activities |
Demonstrates marketing’s contribution to business growth |
Area Chart |
|
Marketing Qualified Leads (MQLs) |
Leads meeting predefined marketing criteria |
Measures the quality of lead generation efforts |
KPI Card |
|
Sales Qualified Leads (SQLs) |
Leads accepted by the sales team |
Tracks alignment between marketing and sales |
Funnel Visualization |
|
Email Open Rate |
Percentage of recipients who open marketing emails |
Reflects subject line effectiveness and audience engagement |
Line Chart |
|
Email Click-Through Rate |
Percentage of recipients clicking links in emails |
Measures email content performance |
Bar Chart |
|
Cost Per Conversion |
Average cost for each completed conversion |
Assesses campaign efficiency beyond clicks |
KPI Card |
|
Pipeline Generated |
Sales pipeline value created through marketing |
Connects marketing efforts to revenue opportunities |
Waterfall Chart |
|
Revenue by Campaign |
Revenue attributed to individual campaigns |
Identifies top-performing marketing initiatives |
Stacked Bar Chart |
|
Organic Traffic |
Website visits from unpaid search engines |
Measures SEO effectiveness and brand visibility |
Line Chart |
|
Paid Traffic |
Visits generated from paid advertising campaigns |
Evaluates paid media performance |
Area Chart |
|
Attribution Revenue |
Revenue assigned through attribution models |
Supports smarter budget allocation across channels |
Sankey or Flow Diagram |
Practical Tip: Avoid tracking every available metric. Prioritize KPIs that align with your business goals. Executive dashboards should focus on revenue, pipeline, ROAS, and customer acquisition, while channel specific dashboards can include tactical metrics such as CTR, CPC, and email engagement. This layered approach keeps reporting focused, actionable, and aligned with decision-making.
Data Sources to Connect
One of Power BI's greatest strengths is its ability to consolidate data from virtually any marketing platform into a single reporting environment. Instead of reviewing separate dashboards for advertising, web analytics, CRM, and email marketing, teams can create a unified view of the entire customer journey.
The value of a marketing analytics dashboard Power BI solution increases as more relevant data sources are integrated. Connecting both marketing and sales systems enables organizations to measure not only campaign performance but also pipeline contribution, customer acquisition, and revenue.
Google Ads
Google Ads remains one of the most important data sources for performance marketers. Integrating it with Power BI enables continuous monitoring of paid search and display campaigns without manually exporting reports.
Common metrics include:
-
Impressions
-
Clicks
-
Click-through rate (CTR)
-
Cost per click (CPC)
-
Cost per conversion
-
Conversions
-
Conversion value
-
Return on ad spend (ROAS)
-
Campaign spend
-
Search impression share
With a dedicated Google Ads Power BI dashboard, marketers can compare campaign performance over time, identify high performing keywords, and optimize budget allocation.
Meta Ads (Facebook & Instagram)
Meta Ads generate significant volumes of engagement and conversion data across Facebook and Instagram.
Key metrics include:
-
Reach
-
Impressions
-
Frequency
-
Cost per result
-
Engagement rate
-
Link clicks
-
Leads
-
Purchases
-
ROAS
-
Audience performance
Combining Meta Ads with Google Ads allows marketers to compare paid social and paid search performance within a single dashboard.
LinkedIn Ads
For B2B organizations, LinkedIn Ads often play a critical role in lead generation.
Power BI dashboards commonly monitor:
-
Sponsored campaign performance
-
Lead generation forms
-
Cost per lead
-
Company size targeting
-
Industry engagement
-
Job title performance
-
Conversion rates
This helps marketing teams evaluate whether premium advertising costs are translating into qualified pipeline.
Google Analytics 4 (GA4)
GA4 provides essential insights into website behavior and customer interactions.
Typical metrics include:
-
Users
-
Sessions
-
Engagement rate
-
Average engagement time
-
Landing pages
-
Events
-
Conversions
-
Revenue
-
Traffic sources
-
Device performance
When combined with advertising data, GA4 helps marketers understand what happens after a visitor clicks an ad, making it a cornerstone of any campaign performance report.
Google Search Console
Organic search continues to be a major driver of sustainable growth. Search Console data complements GA4 by showing how users discover your website through search engines.
Useful metrics include:
-
Search impressions
-
Clicks
-
Average position
-
Click through rate
-
Top performing pages
-
Search queries
-
Indexing performance
Together, GA4 and Search Console provide a complete picture of SEO performance.
HubSpot
HubSpot integrates marketing automation, CRM, and sales data, making it an invaluable source for end-to-end reporting.
Power BI dashboards can visualize:
-
Marketing Qualified Leads (MQLs)
-
Sales Qualified Leads (SQLs)
-
Pipeline value
-
Deal stages
-
Revenue attribution
-
Campaign influence
-
Contact lifecycle
-
Email engagement
This creates a direct connection between marketing activity and revenue generation.
Salesforce
Salesforce remains one of the most widely used enterprise CRM platforms.
Integrating Salesforce with Power BI allows organizations to measure:
-
Opportunity pipeline
-
Closed revenue
-
Win rates
-
Sales cycle duration
-
Customer acquisition
-
Lead source performance
-
Campaign influence
-
Forecast accuracy
Marketing teams gain visibility into which campaigns produce the highest value customers rather than simply the most leads.
Microsoft Dynamics 365
Organizations operating within the Microsoft ecosystem often rely on Dynamics 365 for CRM and sales management.
Power BI integration supports reporting on:
-
Lead progression
-
Opportunity management
-
Revenue forecasting
-
Customer segmentation
-
Sales performance
-
Marketing attribution
-
Pipeline growth
Native integration reduces implementation complexity and supports enterprise grade reporting.
Email Marketing Platforms
Email remains one of the highest performing digital marketing channels when executed effectively. Integrating email platforms allows marketers to evaluate how campaigns contribute to engagement, lead nurturing, and revenue.
Popular platforms include:
-
Mailchimp
-
Klaviyo
-
ActiveCampaign
An email marketing analytics dashboard typically includes:
-
Open rate
-
Click-through rate
-
Bounce rate
-
Unsubscribe rate
-
Revenue generated
-
Conversion rate
-
Email list growth
-
Automation performance
Combining email metrics with CRM data provides visibility into how nurturing campaigns influence sales outcomes.
SQL Databases
Many organizations store operational data in SQL Server, Azure SQL, MySQL, or PostgreSQL databases.
SQL integration enables reporting on:
-
Product sales
-
Customer records
-
Internal marketing systems
-
Transaction history
-
Revenue data
-
Inventory
-
Custom business metrics
SQL databases often serve as the foundation of enterprise reporting models.
Excel and CSV Files
Despite the rise of cloud-based applications, spreadsheets remain an important business data source.
Power BI can automate reporting from:
-
Budget spreadsheets
-
Campaign planning files
-
Offline lead lists
-
Monthly sales exports
-
Marketing calendars
-
Historical performance data
Automating spreadsheet imports reduces manual effort while maintaining compatibility with existing business processes.
APIs and Custom Data Sources
Modern marketing stacks often include specialized tools that are not supported through native connectors.
Power BI can retrieve data from REST APIs and other custom integrations to include:
-
Call tracking systems
-
Webinar platforms
-
Survey tools
-
Customer success software
-
Affiliate marketing platforms
-
E-commerce platforms
-
Proprietary business applications
This flexibility enables organizations to build dashboards that accurately reflect their unique marketing ecosystem.
Choosing the Right Data Sources
Not every organization requires every integration. The right combination depends on your marketing strategy, reporting objectives, and business maturity.
|
Business Goal |
Recommended Data Sources |
|---|---|
|
Paid advertising optimization |
Google Ads, Meta Ads, LinkedIn Ads |
|
Website performance |
GA4, Search Console |
|
Lead generation |
HubSpot, Salesforce, Dynamics 365 |
|
Email marketing |
Mailchimp, Klaviyo, ActiveCampaign |
|
Revenue reporting |
CRM, SQL Database, ERP |
|
Executive reporting |
All major marketing and sales platforms |
|
Agency client reporting |
Advertising platforms, GA4, CRM, Excel uploads |
|
Custom business analytics |
APIs, SQL, cloud databases |
Best Practice: Build your dashboard around a governed data model rather than connecting every source directly to every report. A centralized semantic model improves performance, ensures consistent KPI definitions, and simplifies long term maintenance.
Example Marketing Analytics Dashboard Layout
A successful dashboard tells a story. Rather than presenting dozens of disconnected charts, it should guide decision-makers from high level performance indicators to detailed campaign insights.
The following layout is designed for executives, marketing managers, and performance teams who need both strategic oversight and operational detail.
Section 1: Executive KPI Summary
This section should appear at the top of the dashboard and provide an instant snapshot of marketing performance.
Recommended KPI cards include:
-
Total Revenue
-
Marketing Spend
-
ROAS
-
ROI
-
Total Leads
-
Marketing Qualified Leads
-
Sales Qualified Leads
-
Pipeline Generated
-
Customer Acquisition Cost (CAC)
-
Conversion Rate
Use conditional formatting to highlight positive and negative performance trends.
Section 2: Campaign Overview
Provide a consolidated view of all active campaigns.
Recommended visuals:
-
Campaign performance table
-
Spend by campaign
-
Revenue by campaign
-
ROAS ranking
-
Conversion comparison
-
Budget utilization
Enable slicers for:
-
Date
-
Campaign
-
Channel
-
Region
-
Product
-
Marketing team
This allows users to quickly compare campaign effectiveness.
Section 3: Lead Generation Funnel
A visual funnel helps identify where prospects are dropping out of the acquisition process.
Typical stages include:
Website Visitors
↓
Leads
↓
Marketing Qualified Leads (MQLs)
↓
Sales Qualified Leads (SQLs)
↓
Opportunities
↓
Customers
Displaying conversion rates between each stage helps identify bottlenecks and optimize lead nurturing.
Section 4: ROAS Tracking Dashboard
A dedicated ROAS tracking dashboard enables marketers to evaluate advertising efficiency across channels.
Recommended metrics:
-
Spend
-
Revenue
-
ROAS
-
Cost per acquisition
-
Conversion value
-
Revenue trend
-
Best performing campaigns
Useful visualizations include:
-
Gauge charts
-
Line charts
-
Waterfall charts
-
Campaign ranking tables
Section 5: Budget Spend Monitoring
Marketing budgets change throughout the month, making spend visibility essential.
Include:
-
Budget vs Actual Spend
-
Remaining Budget
-
Spend by Channel
-
Daily Spend Trend
-
Monthly Forecast
-
Budget Utilization %
This section helps prevent overspending while ensuring high performing campaigns receive sufficient investment.
Section 6: Channel Performance Comparison
Not every channel delivers the same return.
Compare channels using metrics such as:
|
Channel |
Metrics to Compare |
|---|---|
|
Google Ads |
ROAS, CPC, CPA |
|
Meta Ads |
Engagement, ROAS |
|
LinkedIn Ads |
CPL, SQLs |
|
Organic Search |
Sessions, Conversions |
|
Email Marketing |
Open Rate, Revenue |
|
Referral |
Leads, Revenue |
Interactive filters allow users to compare performance across different time periods and customer segments.
Section 7: Geographic Performance
Location based reporting helps identify regional trends and opportunities.
Recommended metrics:
-
Revenue by region
-
Leads by location
-
Conversion rate
-
Advertising spend
-
Customer acquisition cost
-
Regional ROAS
Power BI's map visuals make geographic analysis intuitive for executives and regional managers.
Section 8: Email Analytics
Email remains a key driver of customer engagement and retention.
An email marketing analytics section should include:
-
Campaign performance
-
Open rate
-
Click through rate
-
Conversion rate
-
Revenue generated
-
Subscriber growth
-
Automation performance
-
Top performing emails
Trend charts help marketers identify seasonal patterns and improve campaign effectiveness.
Section 9: Top Campaigns
Highlight the campaigns delivering the strongest business outcomes.
Suggested ranking metrics:
-
Revenue
-
ROAS
-
Leads
-
Conversion Rate
-
Pipeline Generated
-
Customer Acquisition Cost
Use dynamic ranking so users can switch between performance measures.
Section 10: Marketing Attribution
Understanding which channels influence conversions is essential for budget optimization.
This section should display:
-
Attribution revenue
-
Assisted conversions
-
Channel contribution
-
Customer journey flow
-
Multi touch attribution
-
Revenue by attribution model
Sankey diagrams, decomposition trees, and flow charts work particularly well for illustrating attribution paths.
Section 11: Revenue Analysis
The final section connects marketing performance directly to business outcomes.
Recommended visuals include:
-
Monthly revenue trend
-
Revenue by campaign
-
Revenue by channel
-
Revenue by product
-
Revenue by customer segment
-
Forecasted revenue
Executives should be able to answer one critical question:
"How is marketing contributing to business growth?"
If the dashboard answers this clearly, it is delivering real business value.
Recommended Dashboard Wireframe
|
Dashboard Area |
Purpose |
Recommended Visual |
|---|---|---|
|
Executive KPIs |
High level business performance |
KPI Cards |
|
Campaign Overview |
Compare campaign performance |
Matrix + Bar Charts |
|
Lead Funnel |
Track conversions |
Funnel Chart |
|
ROAS Analysis |
Advertising efficiency |
Gauge + Line Chart |
|
Budget Monitoring |
Spend management |
Waterfall + KPI Cards |
|
Channel Comparison |
Compare acquisition channels |
Clustered Bar Chart |
|
Geographic Performance |
Regional insights |
Filled Map |
|
Email Analytics |
Engagement performance |
Line & Column Charts |
|
Attribution Analysis |
Customer journey visibility |
Sankey Diagram |
|
Revenue Analysis |
Marketing contribution |
Area Chart |
Design Tip: Keep the most important KPIs above the fold, use a consistent color palette, and limit each page to a handful of key visuals. Interactive drill-through pages can hold detailed analysis without overwhelming users.
Marketing Attribution in Power BI
Modern customer journeys rarely involve a single interaction. A prospect may discover your brand through organic search, click a Google Ad days later, engage with an email campaign, and finally convert after seeing a LinkedIn advertisement.
If every platform claims full credit for the sale, measuring marketing performance becomes unreliable.
This is where marketing attribution Power BI reporting provides significant value. By applying attribution models within Power BI, organizations can evaluate how different marketing channels contribute to conversions and revenue.
Why Attribution Matters
Without a consistent attribution model, marketing teams risk:
-
Overinvesting in channels that appear successful but only capture the final interaction.
-
Undervaluing awareness campaigns that introduce new prospects.
-
Misallocating budgets based on incomplete data.
-
Reporting inconsistent ROI across departments.
Power BI allows marketers to model multiple attribution approaches using a unified dataset, making it easier to compare channel performance and support data-driven budgeting.
First Touch Attribution
Definition:
First Touch Attribution assigns 100% of the conversion credit to the first marketing interaction that introduced the customer to your business.
Best for:
-
Brand awareness campaigns
-
Demand generation
-
Top-of-funnel marketing
-
Measuring customer acquisition sources
Example
Customer journey:
Google Search → Meta Retargeting → Email → Purchase
Credit assigned:
-
Google Search: 100%
-
Meta Ads: 0%
-
Email: 0%
Use this model when your primary goal is understanding which channels generate new prospects.
Last Touch Attribution
Definition:
Last Touch Attribution gives all conversion credit to the final interaction before conversion.
Best for:
-
Conversion optimization
-
Sales focused campaigns
-
Short buying cycles
-
Performance marketing analysis
Example
Google Search → LinkedIn → Email → Purchase
Credit assigned:
-
Email: 100%
This model is simple to understand but often undervalues earlier marketing efforts that influenced the customer journey.
Linear Attribution
Definition:
Linear Attribution distributes conversion credit equally across every customer interaction.
Best for:
-
Multi-channel campaigns
-
Balanced performance reporting
-
Businesses with longer buying journeys
Example
Four marketing touchpoints:
-
Google Ads: 25%
-
LinkedIn: 25%
-
Email: 25%
-
Organic Search: 25%
This approach provides a more balanced view of marketing contribution.
Time Decay Attribution
Definition:
Time Decay Attribution assigns increasing weight to interactions that occur closer to the conversion event.
Best for:
-
Long sales cycles
-
B2B marketing
-
Lead nurturing
-
Enterprise software sales
Recent interactions receive greater credit because they are assumed to have a stronger influence on the final decision.
Position Based Attribution (U-Shaped)
Definition:
Position Based Attribution emphasizes both the first and last interactions while distributing the remaining credit across middle touchpoints.
A common allocation is:
-
First touch: 40%
-
Last touch: 40%
-
Middle interactions: 20%
Best for:
-
B2B lead generation
-
Account based marketing
-
Marketing and sales alignment
This model recognizes the importance of both customer acquisition and conversion while still acknowledging nurturing activities.
Data Driven Attribution
Definition:
Data Driven Attribution uses machine learning and historical conversion data to assign credit based on the actual contribution of each interaction.
Unlike rule-based models, it evaluates patterns across many customer journeys to estimate which touchpoints have the greatest impact on conversions.
Best for:
-
Large marketing datasets
-
Enterprise organizations
-
Mature analytics programs
-
Omnichannel campaigns
While Power BI doesn't generate attribution models on its own, it can consume attribution data from platforms like Google Ads and GA4 or calculate custom models using DAX and integrated datasets.
Choosing the Right Attribution Model
|
Attribution Model |
Best Use Case |
Main Advantage |
Limitation |
|---|---|---|---|
|
First Touch |
Brand awareness |
Highlights acquisition channels |
Ignores later interactions |
|
Last Touch |
Conversion optimization |
Simple and widely understood |
Overcredits the final touchpoint |
|
Linear |
Multi-channel marketing |
Balanced credit distribution |
Treats all interactions equally |
|
Time Decay |
Long B2B sales cycles |
Emphasizes recent engagement |
May undervalue early awareness |
|
Position Based |
Lead generation |
Balances acquisition and conversion |
Uses fixed weighting assumptions |
|
Data Driven |
Mature marketing programs |
Reflects real customer behavior |
Requires significant, high-quality data |
Implementation Recommendation: There is no universally “best” attribution model. Use the model that aligns with your business objectives and buying cycle. Many organizations compare multiple models in Power BI to understand how attribution assumptions influence budget decisions, creating a more balanced and transparent view of marketing performance.
Campaign Performance Reporting Best Practices
A powerful marketing analytics dashboard in Power BI is only valuable if it supports consistent decision-making. The most successful marketing teams establish reporting routines, standardize KPIs, and automate repetitive tasks so they can spend less time preparing reports and more time improving campaign performance.
Monitor Performance Daily
Daily monitoring helps identify issues before they become costly problems. Rather than reviewing every metric, focus on indicators that require immediate action.
Key daily metrics include:
-
Campaign spend
-
ROAS
-
Cost per click (CPC)
-
Cost per acquisition (CPA)
-
Conversion volume
-
Website traffic
-
Lead generation
-
Budget pacing
Set dashboard filters to display "Today," "Yesterday," and "Last 7 Days" for quick comparisons.
What to watch for
-
Sudden increases in CPC
-
Declining conversion rates
-
Campaigns reaching budget limits early
-
Tracking or integration failures
-
Unexpected traffic spikes or drops
Create Weekly Performance Reports
Weekly reports provide enough data to identify trends without waiting until month-end.
A typical weekly report should answer questions such as:
-
Which campaigns improved?
-
Which channels generated the highest ROAS?
-
Are lead volumes increasing?
-
Is pipeline growth on target?
-
Which campaigns require optimization?
Keep executive summaries concise and focus on insights rather than listing every available metric.
Build Executive Scorecards
Executives rarely need campaign level details. Instead, they want to understand business outcomes.
Include KPIs such as:
-
Marketing Spend
-
Revenue Influenced
-
ROAS
-
ROI
-
Marketing Qualified Leads (MQLs)
-
Sales Qualified Leads (SQLs)
-
Pipeline Generated
-
Customer Acquisition Cost (CAC)
-
Revenue by Channel
Present these metrics as KPI cards with month-over-month and year-over-year comparisons.
Use Anomaly Detection
One advantage of Power BI is its ability to surface unusual performance changes automatically.
Examples include:
-
Conversion rates dropping unexpectedly
-
Sharp increases in advertising costs
-
Website traffic anomalies
-
Revenue fluctuations
-
Email engagement declines
Identifying anomalies early allows teams to investigate root causes before performance deteriorates further.
Benchmark Performance
Performance is easier to evaluate when compared against meaningful benchmarks.
Compare:
-
Current month vs previous month
-
Current quarter vs previous quarter
-
Year-over-year performance
-
Campaign vs campaign
-
Channel vs channel
-
Actual vs target
Benchmarking provides context that raw numbers alone cannot.
Automate Reporting
Manual reporting is one of the biggest barriers to marketing efficiency.
Automating data refreshes and report distribution can save hours each week while improving consistency.
Automation best practices include:
-
Scheduled dataset refreshes
-
Automated executive report distribution
-
Shared Power BI workspaces
-
Standardized KPI calculations
-
Centralized semantic models
Configure Alerts
Power BI alerts help teams respond quickly when performance changes.
Useful alert scenarios include:
-
ROAS below target
-
Budget exceeds threshold
-
Lead volume declines
-
Website traffic spikes
-
Conversion rate drops
-
Pipeline growth exceeds expectations
Alerts reduce the need for constant dashboard monitoring while ensuring important changes are not overlooked.
Best Practice: Create different dashboard views for executives, marketing managers, and analysts. Each audience requires a different level of detail, and tailored reports improve adoption across the organization.
Common Marketing Reporting Mistakes
Even organizations with advanced reporting tools can make decisions based on incomplete or inaccurate data. Avoiding the following mistakes improves dashboard reliability and builds trust in reported metrics.
Focusing on Vanity Metrics
High impressions, page views, or social media likes may appear impressive but do not necessarily contribute to business growth.
Instead, prioritize metrics that demonstrate business impact, such as:
-
Revenue
-
Pipeline generated
-
ROAS
-
Customer acquisition cost
-
Conversion rate
-
Customer lifetime value
Using Inconsistent Attribution Models
When different teams use different attribution methods, performance reports become difficult to compare.
Establish a consistent attribution framework and document it clearly so stakeholders understand how conversions are assigned.
Allowing Duplicate Leads
Duplicate records inflate lead counts and distort conversion rates.
Implement data quality rules that:
-
Remove duplicate contacts
-
Standardize customer identifiers
-
Merge CRM records
-
Validate imported datasets
Reliable dashboards depend on clean source data.
Missing Campaign Tagging
Without consistent UTM parameters and campaign naming conventions, marketing attribution becomes unreliable.
Create organization wide standards for:
-
Campaign names
-
Source
-
Medium
-
Content
-
Term
-
Landing pages
Consistent tagging improves reporting accuracy across all channels.
Ignoring Data Quality
Power BI can visualize data effectively, but it cannot correct inaccurate source data.
Regularly audit:
-
Missing values
-
Invalid dates
-
Incorrect currencies
-
Duplicate transactions
-
Broken relationships
-
Failed refreshes
Good dashboards begin with good data.
Relying on Manual Reporting
Manual exports increase the risk of:
-
Human error
-
Version control issues
-
Delayed reporting
-
Inconsistent calculations
Automated refreshes and centralized datasets eliminate many of these challenges.
Keeping Data in Silos
Marketing performance cannot be measured accurately if advertising, CRM, website, and revenue data remain disconnected.
Integrating these systems creates a complete view of the customer journey and enables more informed decision-making.
Why Businesses Choose DataFlip
Implementing a marketing analytics solution requires more than connecting data sources. Organizations need dashboards that are reliable, scalable, and aligned with business objectives.
DataFlip helps businesses accelerate this process by delivering Power BI solutions designed specifically for executive reporting and marketing analytics.
Rather than starting from a blank canvas, organizations can deploy dashboards based on proven reporting frameworks and customize them to match their marketing strategy.
Key benefits include:
-
Ready-made Power BI dashboards
-
Customizable reports and KPI scorecards
-
Fast implementation with minimal disruption
-
Automated data refresh and reporting
-
Executive level performance reporting
-
Comprehensive KPI monitoring
-
Marketing analytics expertise
-
Scalable architecture for growing organizations
-
Modern, user-friendly dashboard design
Whether you are tracking paid advertising, lead generation, marketing attribution, or revenue performance, DataFlip's solutions help transform fragmented marketing data into actionable business intelligence.
The goal is not simply to build dashboards but to provide decision makers with timely, trustworthy insights that support continuous improvement.
Conclusion
Marketing teams are expected to do more with data than ever before. Success depends on understanding which campaigns generate qualified leads, which channels drive revenue, and where marketing investments produce the strongest returns.
A marketing analytics dashboard in Power BI brings these insights together in a single, interactive environment. By connecting advertising platforms, CRM systems, web analytics, and email marketing tools, organizations gain a unified view of campaign performance and customer acquisition.
The benefits extend beyond reporting. Automated refreshes reduce manual work, standardized KPIs improve consistency, and interactive dashboards help teams identify opportunities faster. Combined with well-designed attribution models and strong data governance, Power BI becomes a strategic platform for data driven marketing decisions.
Whether you are managing campaigns for a growing business or overseeing enterprise marketing operations, investing in a modern Power BI marketing dashboard enables faster decisions, improved ROI, and better alignment between marketing activities and business outcomes.
If you are looking to accelerate your analytics journey, explore DataFlip's Power BI marketing dashboard solutions to see how ready-made and customized dashboards can help your team automate reporting, monitor performance in real time, and turn marketing data into measurable business value.
Key Takeaways
-
Centralize marketing data from all major platforms into one Power BI dashboard.
-
Focus on business impact KPIs instead of vanity metrics.
-
Automate reporting to improve efficiency and reduce manual work.
-
Use attribution models that align with your marketing objectives.
-
Maintain consistent campaign tagging and high-quality source data.
-
Design dashboards around business questions, not individual data sources.
-
Create audience specific reports for executives, managers, and analysts.
-
Continuously benchmark performance and monitor anomalies to optimize ROI.
Your marketing data should help you make faster, smarter decisions, not create more reporting work.
Whether you need an executive dashboard, campaign performance reporting, marketing attribution analysis, or a fully customized Power BI solution, DataFlip can help you transform disconnected marketing data into actionable business intelligence.
Explore DataFlip's Power BI marketing dashboard solutions and discover how automated, scalable reporting can help your team track campaigns, improve ROAS, optimize lead generation, and make every marketing dollar count.
Frequently Asked Questions (FAQ)
1. What is a marketing analytics dashboard?
A marketing analytics dashboard is a centralized reporting solution that combines data from multiple marketing platforms into a single view, helping organizations monitor KPIs, campaign performance, lead generation, and revenue.
2. Can Power BI connect to Google Ads?
Yes. Power BI can connect to Google Ads through native connectors, third party connectors, or APIs, enabling automated reporting for campaigns, clicks, conversions, costs, and ROAS.
3. How do you calculate ROAS?
ROAS is calculated using the following formula:
ROAS = Revenue Generated ÷ Advertising Spend
For example, if a campaign generates $50,000 in revenue from $10,000 in advertising spend, the ROAS is 5:1.
4. What marketing KPIs should businesses monitor?
Important KPIs include ROAS, ROI, CPC, CPA, CPL, conversion rate, CTR, CAC, customer lifetime value, MQLs, SQLs, pipeline generated, campaign revenue, and attribution revenue.
5. Can Power BI automate campaign reporting?
Yes. Power BI supports scheduled refreshes, automated dashboards, and report sharing, significantly reducing manual reporting effort.
6. Does Power BI support marketing attribution?
Yes. Power BI can visualize and analyze first touch, last touch, linear, time decay, position based, and data-driven attribution models using integrated marketing data.
7. Which marketing platforms integrate with Power BI?
Power BI integrates with Google Ads, Meta Ads, LinkedIn Ads, Google Analytics 4, Google Search Console, HubSpot, Salesforce, Microsoft Dynamics 365, Mailchimp, Klaviyo, ActiveCampaign, SQL databases, Excel, CSV files, and REST APIs.
8. How often should a marketing dashboard refresh?
Critical dashboards often refresh several times each day. Executive dashboards may refresh daily, while operational dashboards benefit from more frequent updates depending on business requirements.
9. Is Power BI suitable for digital marketing agencies?
Yes. Agencies use Power BI to consolidate client reporting, automate campaign performance reports, compare channels, and provide interactive dashboards with role-based access.
10. Why is marketing attribution important?
Marketing attribution helps businesses understand how different marketing channels contribute to conversions and revenue, enabling more informed budget allocation and campaign optimization.
About the Author


