How to Leverage Power BI Templates for Sales Performance Analysis
Posted on February 25, 2024
Contents
Sales is a dynamic world where one decision can make or break your path toward success. In that, it's quite critical to be crystal clear regarding performance metrics. Some game-changer actions are predicting trends before they happen, pointing chokepoints in real time, and making data-driven decisions that will help propel your organization to new heights. Leveraging Power BI templates can turn this futuristic fantasy into a reality for your business. You can transform mountains of raw data into insightful information for advanced sales performance analysis with Power BI. Interactive visuals unlock the hidden treasure of your sales data. Let’s explore in this blog.
What are Power BI Templates
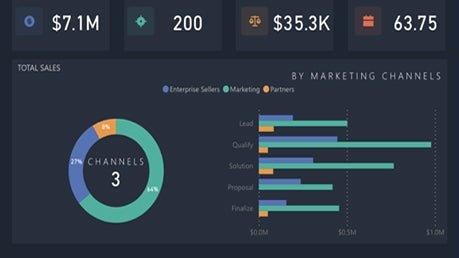
Imagine you are a sales professional in an ABC company with some sales data. Now, you need an effective and quick way to analyze this data to boost performance of your company in terms of sales. Here comes Power BI template in rescue for you, which will convert your data into dynamic visuals instantly. You can track the performance with real-time sales charts. Top regions for customer acquisition can be identified with heatmap. A sales funnel analyzer will help you to spot drop-off leads. A leaderboard will go a step further in highlighting top performers from your sales team.
After all, it's only linking data to any Power BI template and modifying a few metrics. With meaningful representations of your complex data, actionable insights, and clearer visuals, you'll be able to drive better improvements in sales performance.
Benefits of Using Power BI Templates
- Time-saving: Power BI templates are your pro-time-saving sidekick that easily fit into your unique business needs with features to customize pre-built reports.
- Visual storytelling: It is easy to communicate insights to stakeholders with visualizations of the Power BI template that will help transform your data into a compelling story.
- Interactive dashboards: Interactive dashboards present in Power BI templates can go deeper in terms of providing a drill down into data which enhances insights.
- Consistent reporting: The consistency of the reports that emanates from Power BI templates will enable organizations at every level to make better decision making.
Using Power BI Templates for Better Sales Performance Analysis
- Choosing the right template: During the application of the Power BI templates for better sales performance analysis, an organization shall choose the one that best fits their industry and specific business needs. One example would be a report that tracks income or a dashboard that shows sales.
- Editable template: The template provided by Power BI can be customized for some of your preferences. There may be some points where you may want to insert or delete some features, alter some of the metrics displayed or even change any of its graphics.
- Add data sources: By integrating data sources into the template, Power BI gives you real-time sales data. You can integrate relevant data sources such as sales databases or even a CRM system.
- Sales trend analysis: You can analyze sales trends with this template; track the growth in revenues, and top products/sales representatives. You will also be able to monitor metrics from the sales pipeline.
- Insight Sharing: Share projects in Power BI reports and dashboards across the stakeholders and other team members, giving everyone the ability to participate in the analysis, from executive through managers and sales teams, and understand it for informed decision-making.
Tips for Optimizing Sales Data Insights
- Set clear objectives: Defining objectives clearly will be helpful to focus on key areas for improvement. Sales performance analysis can extract actionable insights with clear objectives.
- Utilize filters and slicers: For a deeper analysis, you will have to dice and slice your sales data. Use templates effectively in a way that you do not waste their greatest potential.
- Calculated measures: Using calculated measures, the detailed analysis can be drawn into the template with respect to these metrics—say, for example, sales conversion rate, average deal size, and sales velocity.
- Schedule Automatic Refreshes: As automated refreshes are scheduled, it shall bring out the updated data for analysis.
- Forecasting tools: There are forecasting tools for the sales trends and growth of the business. This shall be helpful to analyze the potential performing capability of the business.
CONCLUSION
Drive your business with this modern sales performance analysis—Power BI templates. Get deeper insights, stay ahead of the competition by making informed data-driven decisions. Your daunting sales data can be turned into a very powerful strategic asset if you work to foster a data-driven culture in your company. The right models can assist your business and provide you more advanced features.
FREQUENTLY ASKED QUESTIONS
1.Can Power BI templates be customized to a specific requirement?
Yes, absolutely, you can personalize existing Power BI templates according to the business need. Just change KPIs and metrics about sales data that you want to be updated.
2.How often should I refresh my sales data in Power BI templates?
Sales data can be scheduled for automated refreshes at regular intervals (daily).
3.Is it free to use Power BI templates?
For all users of Power BI platform, no additional costs are charged to use Power BI templates.
4.Can I share my Power BI personalized dashboard used for the monitoring of sales with others?
It's so easy to share the power BI customized sales reports, either by sharing the given link directly to other users or putting it on the Power BI service itself.
5.What sales metrics should we monitor and analyze when we look at sales statistics?
The concerned metrics are: conversion rates, average deal size, customer acquisition cost (CAC), sales velocity and sales revenue.
About the Author

Mandavi Yadav
A passionate writer exploring themes of culture, tradition, and devotion. Sharing timeless stories that inspire and connect. Bringing the essence of heritage to life through words.


